A pre-flight weather briefing should always include a thorough review of the graphic area forecast to understand the weather system you plan of fly in. Although we include all this material in our Private Pilot Ground School and Commercial Pilot Ground School courses, Here is everything you need to know about a GFA.
What is a GFA in Canada?
The GFA weather charts depict the most probably weather in a given area below 24,000ft. The charts include 3 clouds and weather and 3 icing, turbulence and freezing level that are valid for a specific time period. They can be found on NavCanada’s Collaborative flight planning website or here.
How to Read a Graphical Area Forecast?
Clouds and Weather chart
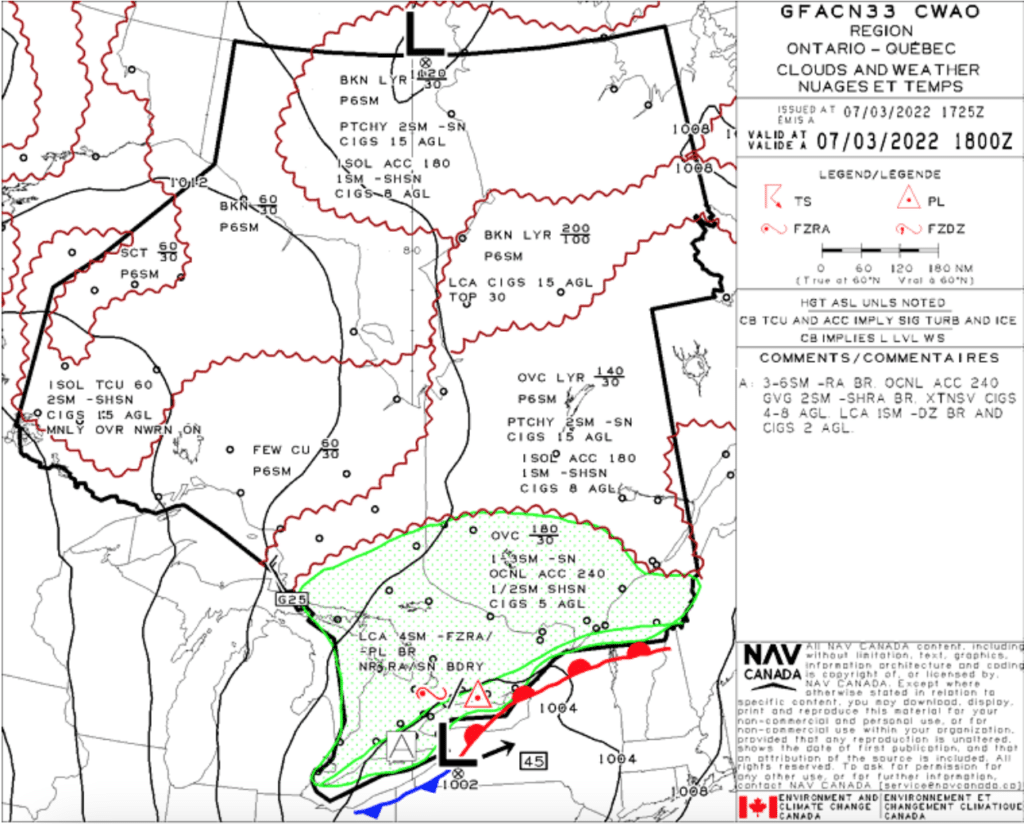
When reading a clouds and weather chart always begin with the title box to determine what time period this chart is valid. The chart is going to forecast clouds layers, visibility, weather and obstruction to vision. The title box includes a symbol legend and comments box where associated weather will be noted for the indicated area.
Isobars
Lines joining equal points of pressure depicted every 4mb. The distance between isobars can be used to infer wind strength, close isobars represent a strong pressure gradient force and strong winds. The opposite is true for isobars spaced far apart.
Synoptic features and GFA Symbols
Cold front, warm front, high pressure and low pressure systems are synoptic features shown on the chart along with their speed and direction. The speed and direction can be used along with the chart scale to forecast where the synoptic feature will be at a time period in-between the chart valid times.
Clouds
Red scalloped borders are used as GFA symbols to indicate the area of forecast cloud base and height above sea level up to 24,000ft. Convective cloud tops will be forecast above 24,000ft. Broken cloud base of 4000 and tops of 8000 would be represented as BKN 80/40. The height of convective cloud can be used to asses the stability of the airmass, Convective cloud development above 24,000ft indicates unstable air and possible turbulent conditions.
Cloud coverage will be assigned as follows:
- SKC- 0 oktas
- FEW – 1-2 oktas
- SCT – 3-4 oktas
- BKN – 5-7 oktas
- OVC – 8 oktas
Visablity – Visibility is forecast in statue miles up to 6SM. If forecast is going to be greater than 6SM it will be shown as P6SM.
Spacial coverage qualifiers – Convective clouds
- ISOLD – isolated – 25% or less
- OCNL – occasional – Greater than 25% up to 50%
- FRQ – Frequent – Greater than 50%
Spacial coverage qualifiers – Non-Convective clouds
- LCL – Local – 25% or less
- PTCHY – patchy – Greater than 25% up to 50%
- FRQ – Frequent – Greater than 50%
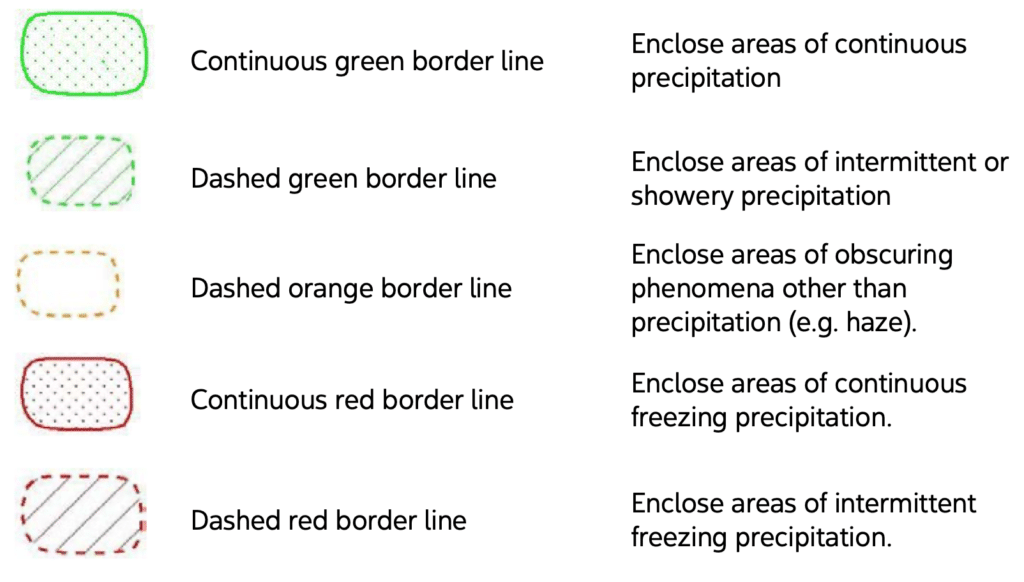
Precipitation GFA Symbols – Areas of precipitation are indicated as follows
Surface winds – Surface wind speed and direction are indicated with arrows if there is a sustained speed of at least 20 knots. Gusts are indicated following the letter “G” (ex. 20G30).
IFR outlook – Found on the last forecast GFA time, the IFR outlook forcasts IFR weather only for an additional 12 hours after the GFA valid time. IFR weather is described as
- Less than 1000′ AGL ceiling or less than 3 SM
Icing, Turbulence and Freezing level chart
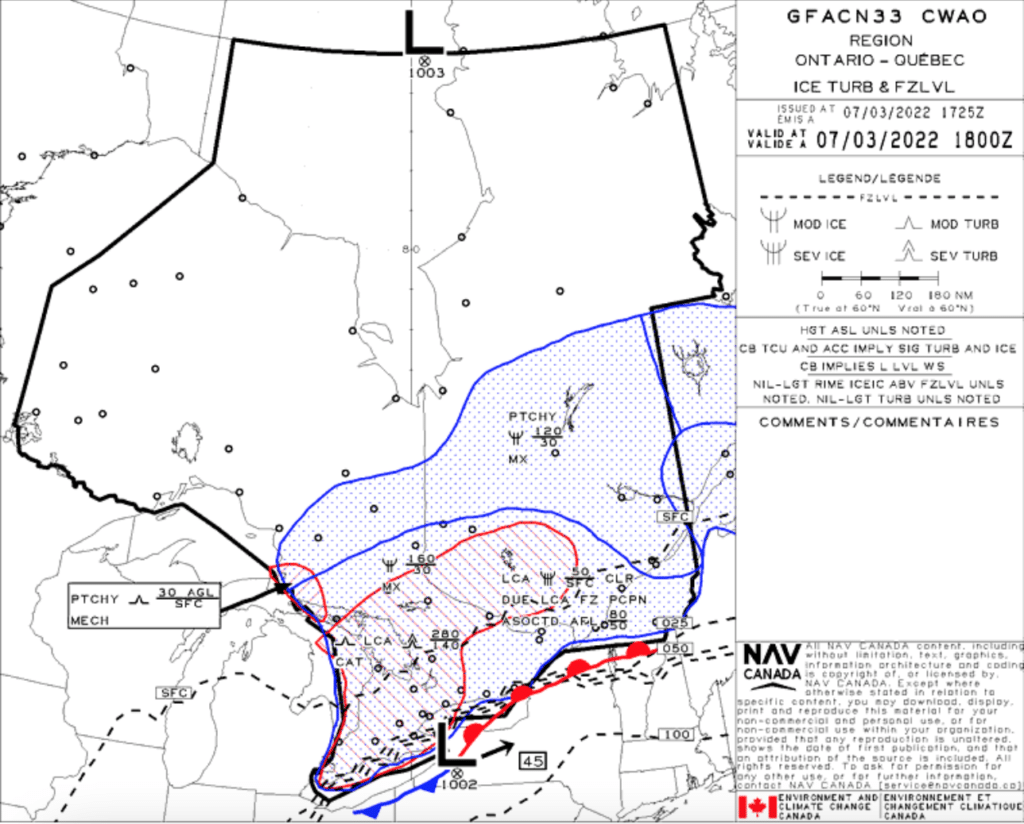
The GFA icing, turbulence and freezing level chart depicts forecast areas of icing and turbulence including the type, intensity, base and tops of each.
GFA Symbols – Icing
Moderate and sever icing is is shown with the base and tops indicated in hundreds of feet above mean sea level unless otherwise indicated. Types of icing include
- Rime
- MXD – mixed
- CLR – clear

GFA Symbols – Turbulence
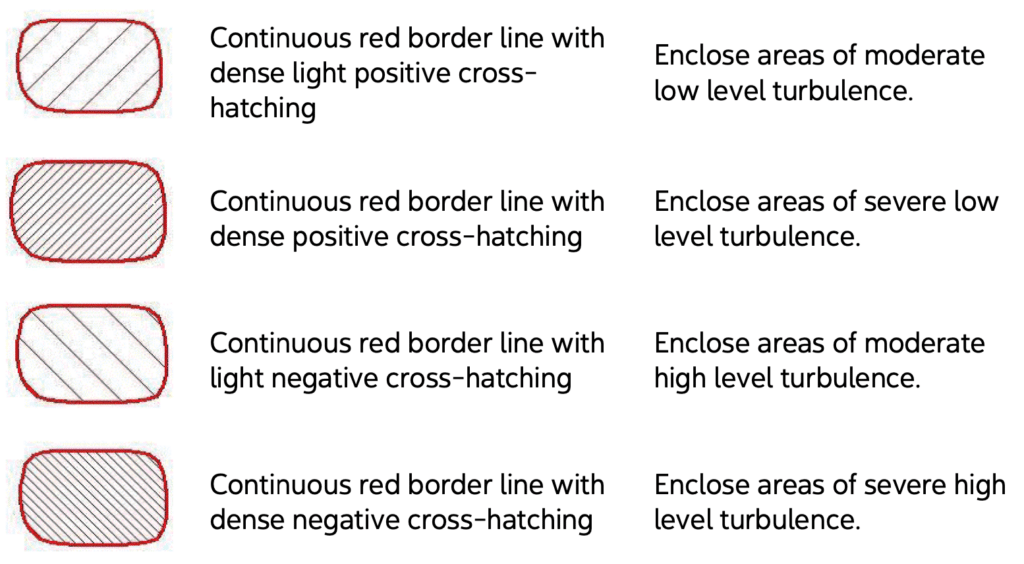
Moderate and sever turbulence is shown with the base and tops indicated in hundreds of feet above mean sea level unless otherwise indicated. Types of turbulence include
- MECH – Mechanical turbulence
- LLWS – Low level wind shear
- LEE – Lee waves
- MV – Mountain waves
- LLJ – Low level jet
- CAT – Clear air turbulence
GFA Symbols – Freezing level
The Freezing level is indicated by dashed lines and indicates the height of the freezing level beginning at the surface and at intervals of 2500 ft MSL.
GFA Symbols – Low level Jet stream
A low level jet will be included if the core speed is 50 knots or more or if there is associated turbulance.
GFA Symbols
Here are the symbols that your will find on a GFA
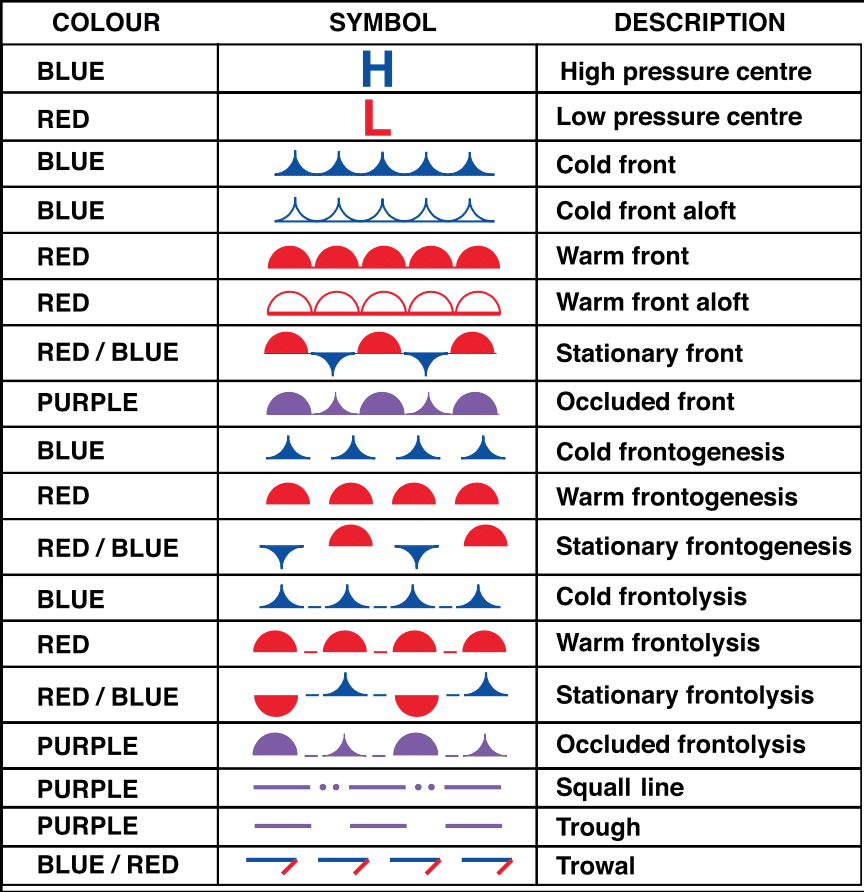
Before your next flight be sure to review the GFA’s and understand the trends of the weather system that you are going to be flying in. Note the forecast trends throughout the day if weather is going to improve or deteriorate and how will this impact the safety of your flight?
We recommend reading Canadian Aviation Weather 3rd Edition for more information on weather in Canada.

